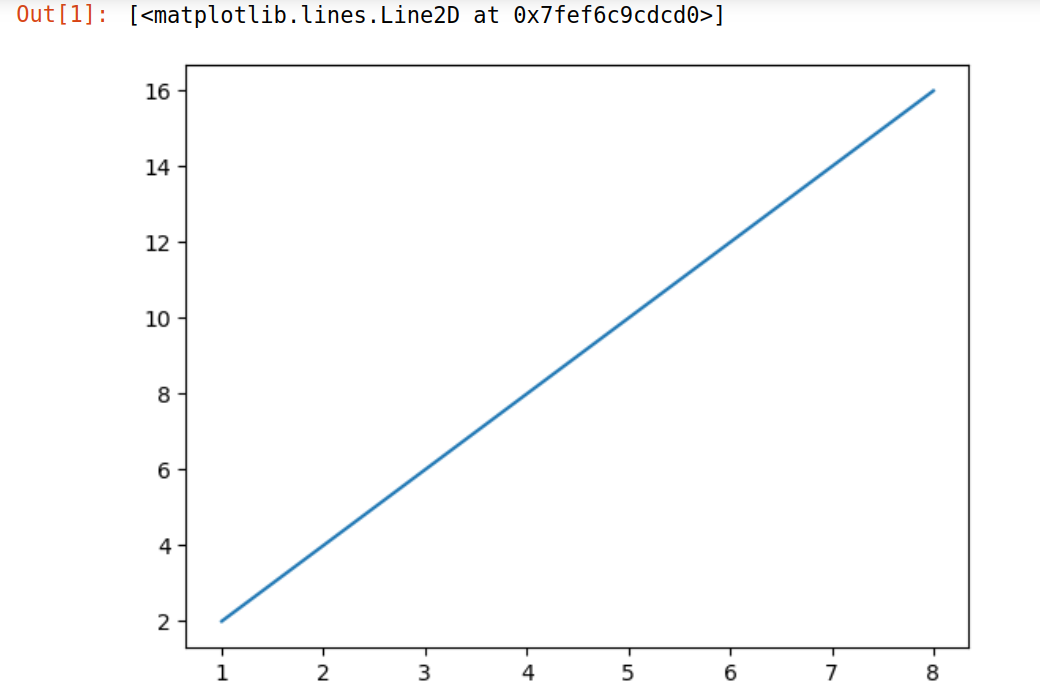
plot(x,y)
jupyter环境,提前是OS得有图形界面,centos肯定是不行的,windows,mac没问题,ubantu安装图形界面就可以
import matplotlib.pyplot as plt
x=[1,2,3,4,5,6,7,8]
y=[2,4,6,8,10,12,14,16]
plt.plot(x,y)
添加水平/垂直线
matplotlib,mat:矩阵,plot:制图,lib:库
import numpy as np
import matplotlib.pyplot as plt
x=np.random.uniform(1,10,10)
y = x*2
plt.plot(x,y)
plt.axhline(y=10,ls="-.",c="#efefef")#添加水平直线
plt.axvline(x=5,ls="-.", c="#ddeedd") #添加垂直直线
# plt.show() # vscode中需要加这一行,jupyter不需要
饼图
import matplotlib.pyplot as plt
# plt.rcParams['font.sans-serif'] = ['SimHei']  # Windows系统
# plt.rcParams['axes.unicode_minus'] = False  # 解决负号显示

# 基础饼图
sizes = [35, 25, 20, 20]
labels = ['A', 'B', 'C', 'D']
plt.pie(sizes, labels=labels, autopct='%1.1f%%', startangle=90)
plt.axis('equal')  # 保持正圆形
plt.title('BBB')
plt.show()

|
import matplotlib.pyplot as plt
# 带突出效果的饼图
explode = (0, 0.1, 0, 0)
plt.pie(sizes, explode=explode, labels=labels,
        autopct='%1.1f%%', shadow=True,
        colors=['#ff9999','#66b3ff','#99ff99','#ffcc99'])
plt.axis('equal')
plt.title('AAAA')
plt.show()

|
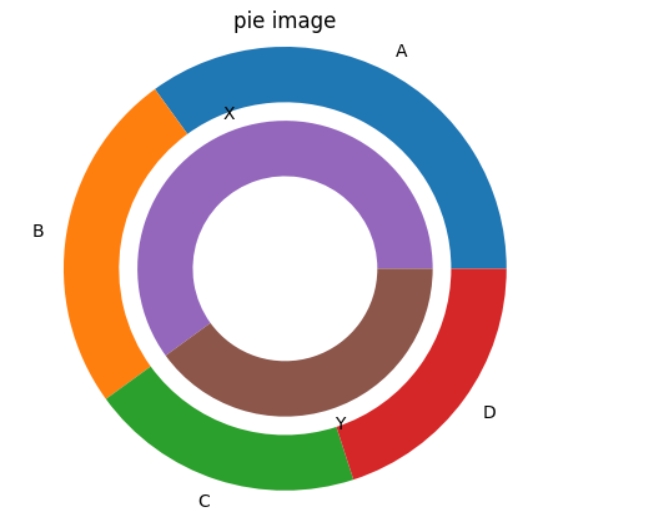
import matplotlib.pyplot as plt
# 嵌套饼图(双层结构)
inner_sizes = [60, 40]
inner_labels = ['X', 'Y']
fig, ax = plt.subplots()
ax.pie(sizes, labels=labels, radius=1.2,
        wedgeprops=dict(width=0.3))
ax.pie(inner_sizes, labels=inner_labels, radius=0.8,
        wedgeprops=dict(width=0.3))
plt.title('pie image')
plt.show()
|
|
|
|
|
tree·二叉树
import networkx as nx
import matplotlib.pyplot as plt

def hierarchy_pos(G, root, width=1., vert_gap=0.2, vert_loc=0, xcenter=0.5):
    pos = {root: (xcenter, vert_loc)}
    neighbors = list(G.successors(root))
    if len(neighbors) != 0:
        dx = width / len(neighbors)
        nextx = xcenter - width/2 - dx/2
        for neighbor in neighbors:
            nextx += dx
            pos.update(hierarchy_pos(
                G, neighbor, width=dx, vert_gap=vert_gap,
                vert_loc=vert_loc-vert_gap, xcenter=nextx))
    return pos

# 示例:强制树形结构(每个节点仅一个父节点)
edges = [
    ('Alice', 'Bob'),
    ('Alice', 'Charlie'),
    ('Charlie', 'David'),
    ('Charlie', 'Eve')
]
G = nx.DiGraph()
G.add_edges_from(edges)

# 计算递归布局坐标
pos = hierarchy_pos(G, 'Alice')

# 绘制图形
plt.figure(figsize=(10, 8))
nx.draw(G, pos, with_labels=True, node_size=2000, node_color='lightgreen',
        arrows=True, font_weight='bold', font_size=12)
plt.title("Custom Recursive Tree Layout")
plt.show()
# 保存矢量图格式(SVG)
plt.savefig('output.svg', format='svg', bbox_inches='tight')

# 保存高分辨率位图(PNG)
plt.savefig('output.png', dpi=300, transparent=True, bbox_inches='tight')
关键参数说明: format:指定输出格式(支持 svg/png/jpg/pdf 等) dpi:设置分辨率,推荐 300 以上用于印刷 transparent:保留图像透明通道 bbox_inches='tight':自动裁剪空白边缘 若需批量生成不同格式文件,可连续调用savefig方法。 注意文件路径需使用合法字符,避免特殊符号。 保存路径默认为当前工作目录,建议使用绝对路径指定特定存储位置。 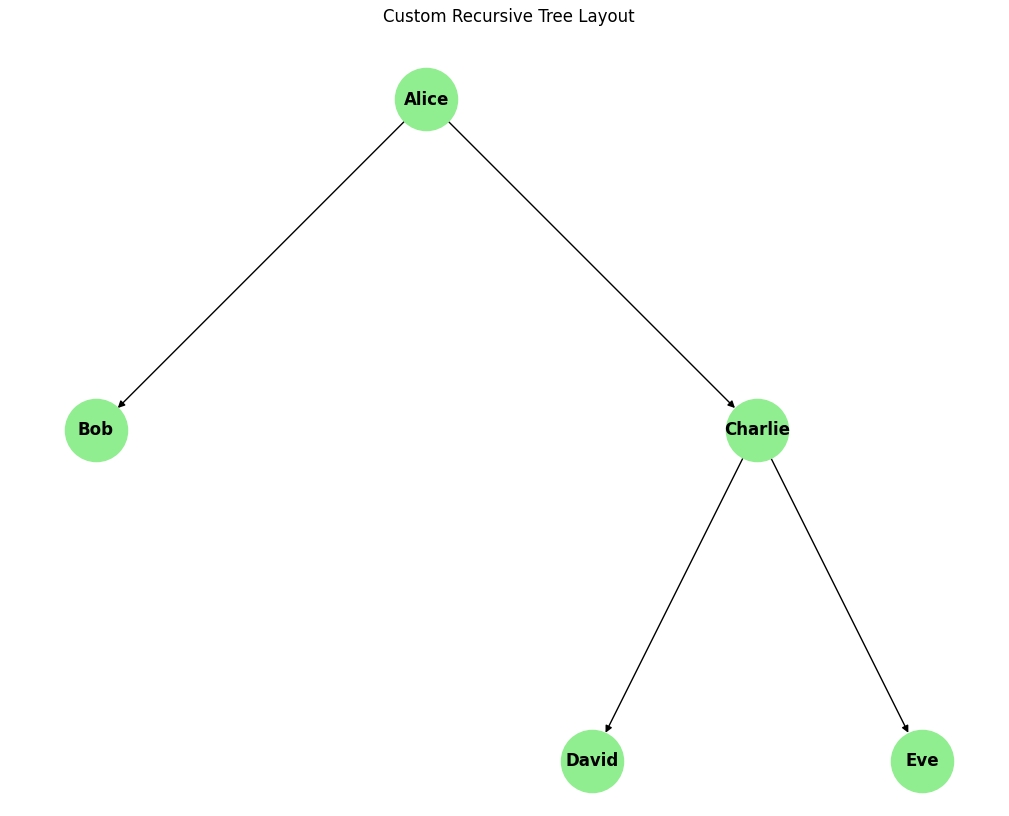
|
注意事项:
1. 有向无环图(DAG)
nx.topological_sort()要求图必须为有向无环图(DAG)
网络数据中不能存在类似(如Alice→Bob→Alice形成的循环)的环状结构
import networkx as nx
import matplotlib.pyplot as plt
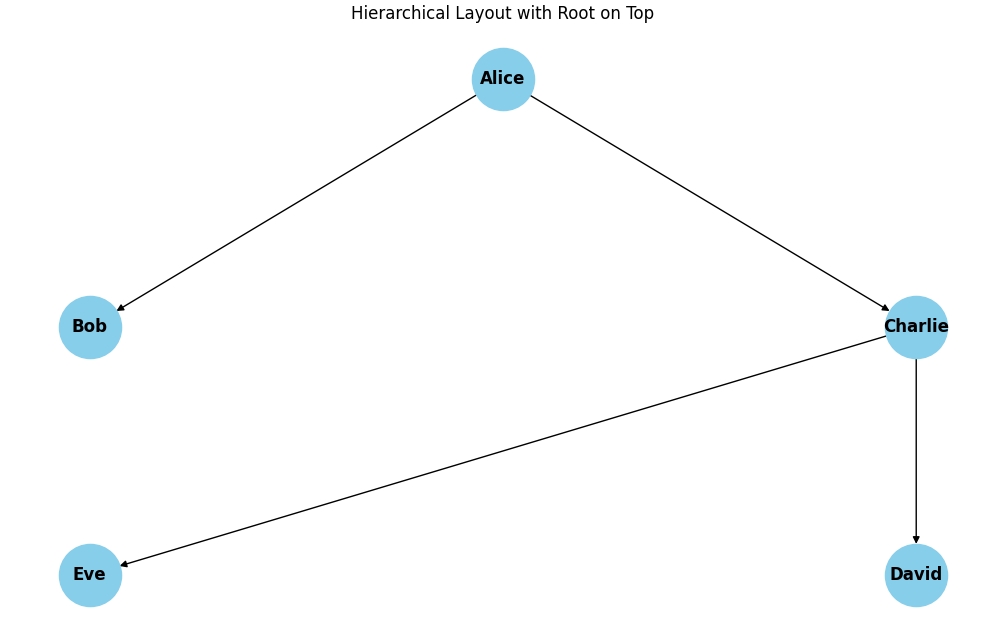
edges = [('Alice', 'Bob'), ('Alice', 'Charlie'), ('Charlie', 'David'), ('Charlie', 'Eve')]
G = nx.DiGraph()
G.add_edges_from(edges)
# 定义层级并添加节点属性
layers = {0: ['Alice'], 1: ['Bob', 'Charlie'], 2: ['David', 'Eve']}
for layer, nodes in layers.items():
for node in nodes:
G.nodes[node]['layer'] = layer
# 生成布局并翻转Y轴
pos = nx.multipartite_layout(G, subset_key='layer', align='horizontal')
for node in pos:
pos[node][1] *= -1 # 反转Y坐标
# 绘制图形
plt.figure(figsize=(10, 6))
nx.draw(G, pos, with_labels=True, node_size=2000, node_color='skyblue',
arrows=True, font_size=12, font_weight='bold')
plt.title("Hierarchical Layout with Root on Top")
plt.show()
|
|
|
|
|
|
|
|
参考