matplotlib 读取图像
matplotlib读取图像的格式 [H,W,C], 其中C为 [R,G,B]
读取结果数据类型 np.ndarray

cv2:[H,W,C],C:B-G-R
matplotlib读取图像示例
from matplotlib import pyplot as plt
img = plt.imread("K:/tmp/a.png")
print(type(img),img.shape)  <class 'numpy.ndarray'> (458, 604, 4)

img[0,1]
array([0.7607843 , 0.79607844, 0.8156863 , 1.        ], dtype=float32)
cv2读取图像示例
import cv2
image = cv2.imread("K:/tmp/a.png")#image :是返回提取到的图片的值
print(type(image),image.shape)  # <class 'numpy.ndarray'> (95, 381, 3)

tmp=image[0,1]
tmp
array([208, 203, 194], dtype=uint8)

tmp = tmp/255
tmp.round(7)
array([0.8156863, 0.7960784, 0.7607843])
差异对比
数据类型都是np.ndarray,

格式都是[H,W,C],
这个格式的意思是[H,W]个3维向量,每个向量3色素
与图像最小单位像素一致,一个3维向量对应一个像素,[H,W]个像素

数值类型
matplotlib的array中float32,cv2的array中unit,并且两者的关系就是 整数值/255

在读取Png图像时,cv2直接舍弃透明度这个维度,matplotlib则将其保留

特征维度C的顺序
matplotlib是RGB,cv2则是其反序BGR
plt.imshow
from matplotlib import pyplot as plt
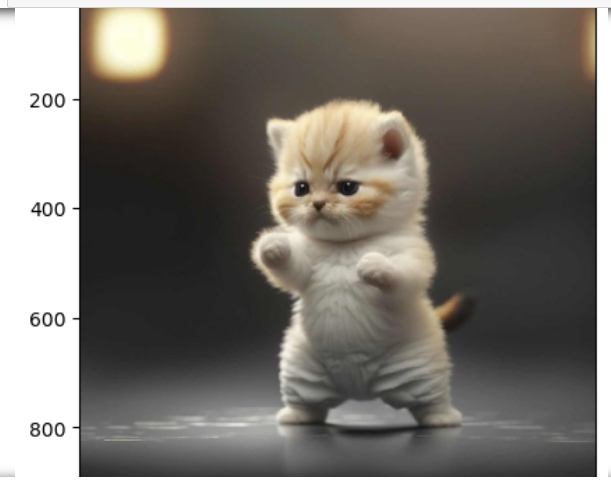
img = plt.imread("lingmao.jpg")
print(img.shape) # (940, 940, 3)
plt.imshow(img)
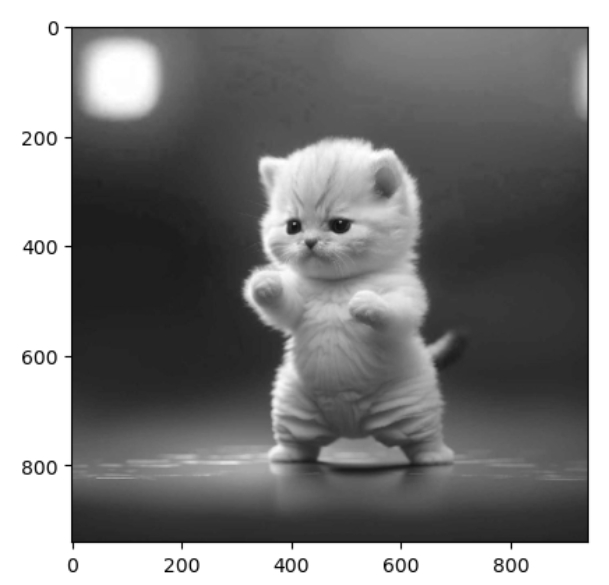
cmap="gray",前提是输入的图像只有一层
img_r = img[:,:,0] # 取出其中一个特征的图
img_r.shape
(940, 940)
plt.imshow(img_r,cmap="gray")
参考